Open an account
Opening an account is simple and takes only a few minutes
Japan 225
Japan 225
- Low:39285.0
- Change-342.0
- High:39823.0
- Change %-0.87%
Market insights
Pivot points are a technical indicator that traders use to predict upcoming areas of technical significance, such as support and resistance. They're calculated by averaging the high, low and closing prices of a previous period. That could be a day, a week or a month.
If a market is trading above its previous pivot point (known as P), it is seen as a bullish signal. If it is below, it is bearish.
Support and resistance levels are a core part of technical analysis, providing crucial insight into possible future price reversals.

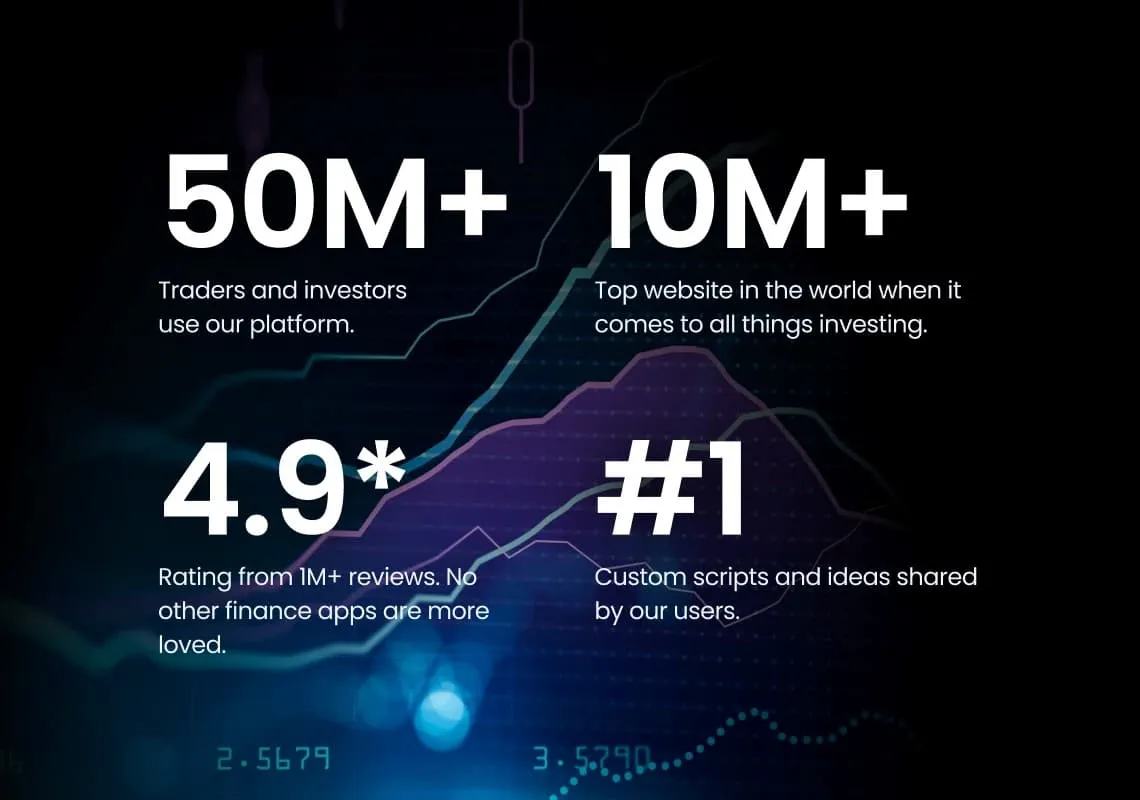
When you trade your FOREX.com account on TradingView.com, you benefit from sharing ideas with their community of over 50 million traders, investors, and analysts in addition to their industry-leading charts and tools.
Whether you are new to trading or a seasoned investor, TradingView delivers on our joint mission to help anyone succeed in financial markets.
-
Japan 225 is our market for the Nikkei 225, the stock index that tracks the top 225 blue-chip companies on the Tokyo Stock Exchange. It’s the country’s leading stock index, Japan’s equivalent of the Dow or the FTSE 100.
The Nikkei is price weighted, which means its price is influenced more by constituents with the largest share prices. Some of the companies with the greatest weight include Sony Corporation, Canon Inc, Nissan Motor Company and Honda Motor Company.
The index was created in 1950 to track the country’s reindustrialisation and growth following World War II.
-
Margin From0 %
-
Trading Hours24 hours / day *
-
Min Trade Size1
-
Long0
-
Short0
-
Min Stop Distance0.0 Points
-
Guaranteed Order Minimum35.0 Points
-
Guaranteed Order Premium7.0 units of quantity
-
Spreads
-
Spreads From7 Points
-
Margins
-
StepMargins
-
Dealing
-
Spreads7 Points
-
Guaranteed Order Min Distance35.0 Points
-
Margins
-
StepMargins
Latest Research
GMT | Event | Vol. | Actual | Consensus | Previous | |||
---|---|---|---|---|---|---|---|---|
Wednesday, Jun 18 | ||||||||
24h | AT | Corpus Christi | 0 | |||||
24h | PL | Corpus Christi | 0 | |||||
24h | PT | Corpus Christi | 0 | |||||
Thursday, Jun 19 | ||||||||
24h | BR | Corpus Christi | 0 | |||||
24h | US | Juneteenth | 0 | |||||
24h | FI | Midsummer’s Eve | 0 | |||||
Friday, Jun 20 | ||||||||
Sunday, Jun 22 | ||||||||
Monday, Jun 23 | ||||||||
Tuesday, Jun 24 | ||||||||
Wednesday, Jun 25 | ||||||||
Thursday, Jun 26 | ||||||||
Friday, Jun 27 |
Japan 225 Indices explained
What are indices?
Read more >
Why trade indices?
Trading indices enables you to get exposure to an entire economy or sector with one single position, instead of opening multiple trades across several companies.
Read more >
How to trade indices
Read more >
